


Where Your Freight May Get Delayed This Week
May 4, 2021
The Choptank Weekly Market Brief is offered exclusively to Choptank Transport customers to provide accurate, timely and relevant freight market information. The contents of this brief are collected from reputable sources including DAT, Freightwaves/Sonar, Truckstop.com, the Department of Labor, the Department of Transportation, and other sources as cited throughout the brief.
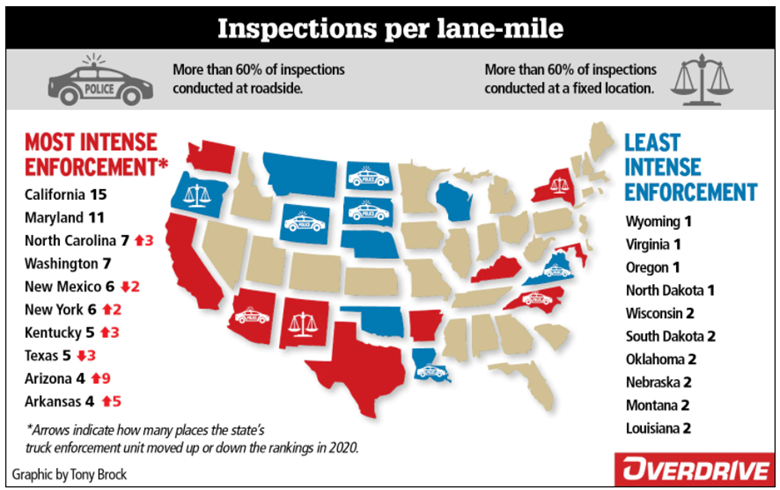
The CVSA roadchecks begin today and Overdrive Online has published a list of states where drivers are most likely to get stopped for roadside inspections. It is no surprise that California is number one, but the number two spot on the list is not what you might have guessed ... it is our own state of Maryland! Rates in affected areas may run as high as 20% - 25% above their normal costs. On the other hand, according to the article's estimates, if your freight is moving through Virginia, Wyoming, or Oregon, you probably don't have too much to worry about regarding roadcheck delays.
_______________
This week's video
Refrigerated Freight Expert Geoff Turner Talks Relationships, Technology, and Data Science.
(4:02 minute clip. To watch the full interview, go here.)
Number of the Week
1,249,095 sq. ft.
This is the square footage of a new mystery distribution center employing 1,000 people called "Project Hornet" located on a 70+ acre site in Turlock, California. No one is confirming yet that it is an Amazon warehouse, but it certainly looks likely. Read the story here.
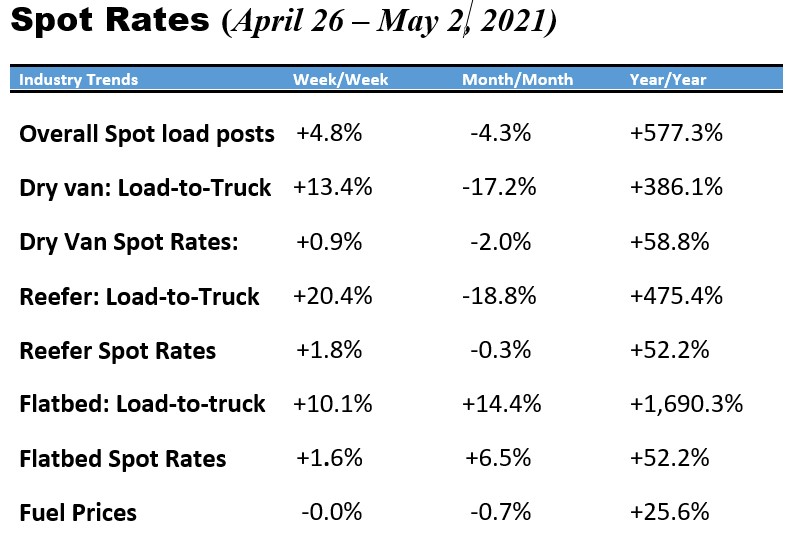
What's Up in the Spot Market?
Dry van rates seemed to have hit their peak in early March, whereas reefers and flatbeds continue to be escalating with little holding them back. Every metric on the week-over-week column is on the plus side, including a significant jump in load-to-truck volumes for all three modes.
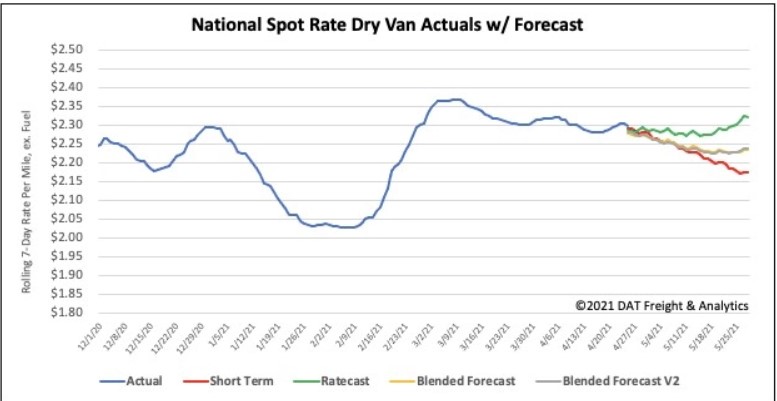
How to interpret the rate forecast:
-
Ratecast: DAT’s core forecasting model
-
Short-Term Scenario: Formerly the pessimistic model that focuses on a more near-term historical dataset
-
Blended Scenario: More heavily weighted toward the longer-term models
Blended Scenario v2: More heavily weighted toward the shorter-term models
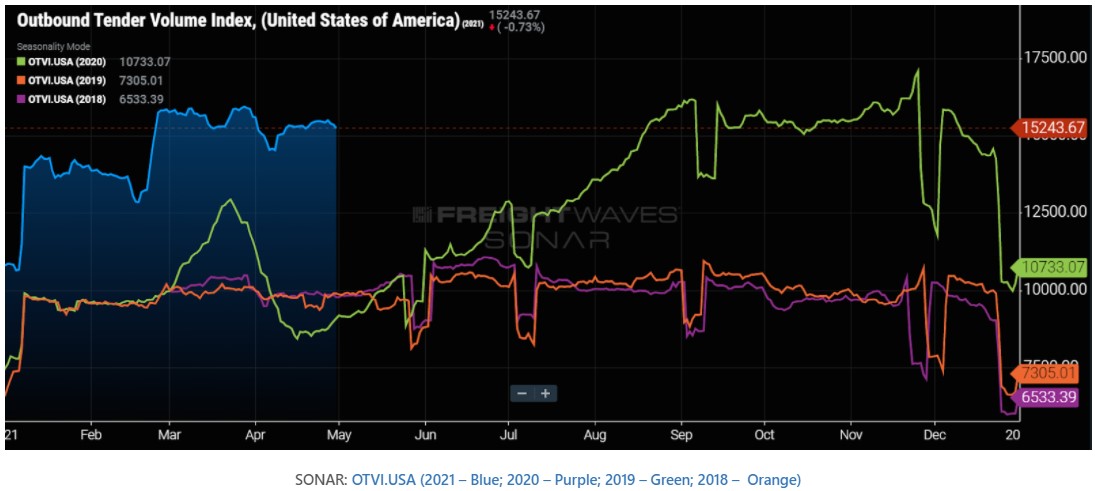
National Outbound Tender Volumes
Unlike rejection rates, volumes on a national level have remained relatively flat over the past several weeks, although still extremely elevated compared with previous years. Analysts are predicting that additional volume increases are likely (which we are seeing today) with more produce freight entering the market, sustained import volumes, and a robust summer housing sector. Add to that a healthy industrial and manufacturing outlook, and the freight market is looking extremely positive.
Areas with the highest volumes: Some of the highest-volume reefer markets this week are Ontario, CA, Atlanta, GA, Fresno, CA, Pendleton, OR, Twin Falls, ID, and Indianapolis, IN.
Chart Below: Blue line shows the current year's data. (Source: Freightwaves/Sonar)
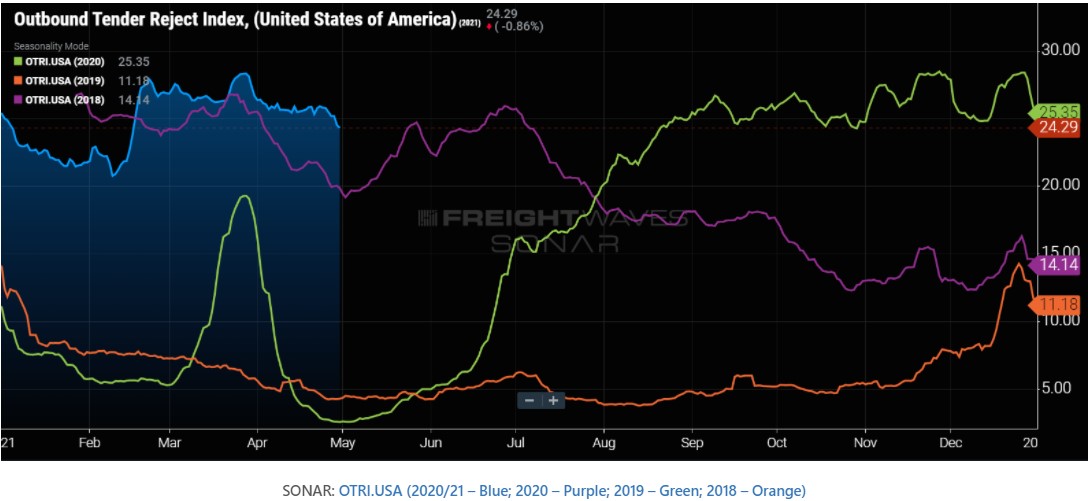
National Outbound Tender Rejections
Overall tender rejections have continued to go down over the last several weeks which means that many areas are finally seeing some relief from February's choked capacity. This is most likely a short-lived reprieve, but only time will tell.
Reefer rejections After hitting a peak in late February and then again in early April, reefer rejections have been on a steady decline ever since. Two weeks ago they were at 47.16% and have slipped down even further the last two weeks to 43.37% on Monday.
Areas with the most increases in rejections: Reefer rejection rates are not declining everywhere. They have climbed to 65% in some markets, such as Little Rock, AR, Tifton, GA, Fayetteville, AR, Des Moines, IA, and Omaha, NE.
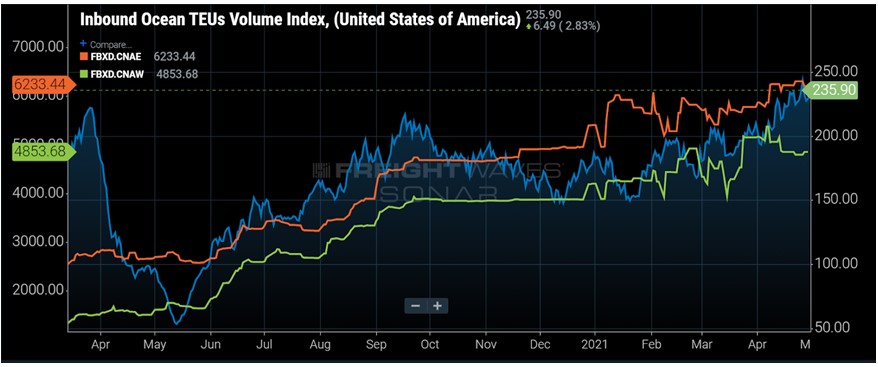
Ports: Trans-Pacific Congestion Expected to Worsen
“Buckle up. The month of May will be the worst people have ever seen,” said Nerijus Poskus, vice president of the global ocean at freight forwarder Flexport.
The port congestion problems we have experienced over the past six months are about to get a whole lot worse, according to an article in American Shipper. What some are calling a "freight tsunami" will test the limits of the entire supply chain and its capabilities.
A recent article in Freightwaves explained, "...ocean container spot rates could soar another 50% - 75% through the remainder of the year, and that still may not be enough to simply get a spot on a container ship."
Economy
Overall consumer spending increased in the first quarter by 10.7%, with the Gross Domestic Product (GDP) increasing 6.4% during that same time. Services, due to vaccinations and outdoor, weather-permitting activities, increased at a less rapid pace of 4.6%.
By the end of this week the Institute for Supply Management (ISM) will release its Purchasing Managers Index (PMI) report, which so far has maintained a strong upward trend over the past 12 months.
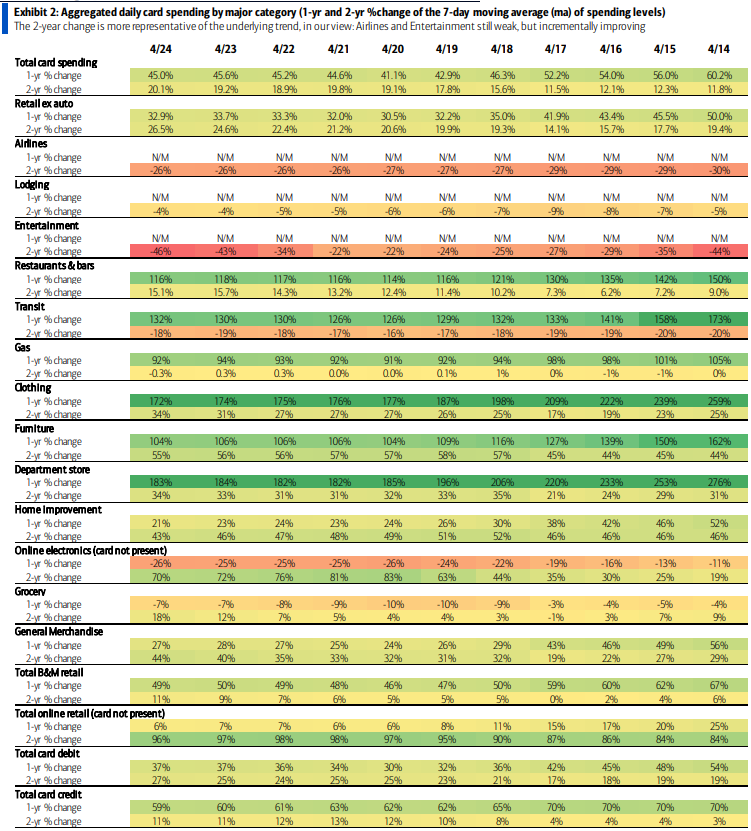
A review of the most recent Bank of America card spending data shows that consumer confidence continues to be positive. Restaurant spending is up this week, coinciding with the warmer weather, and spending on goods remains extremely strong, up by 50% - 70% compared with 2019 (furniture, home improvements, and electronics).
Chart below: (Source: Bank of America Securities)
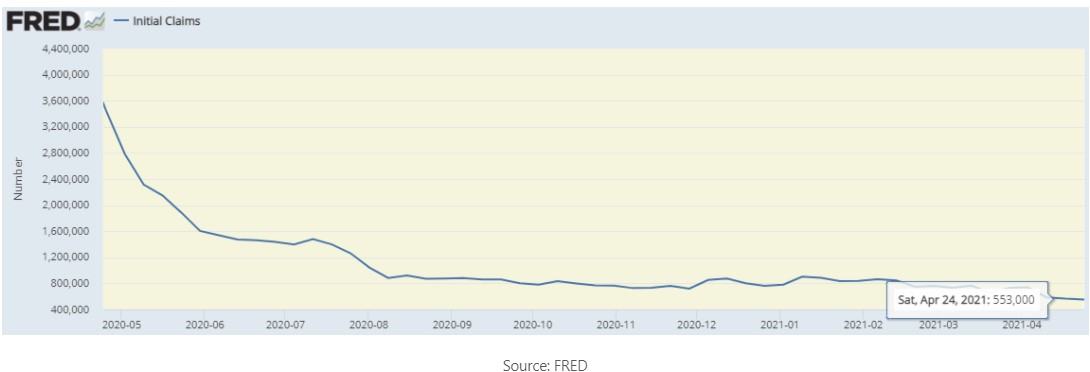
Initial Jobless Claims
Jobless claims are certainly trending in the right direction, hitting the lowest point since the beginning of the pandemic, according to Thursday's Department of Labor report. The number of people applying for unemployment benefits dropped from 566,000 to 553,000, marking the third consecutive week of declines.
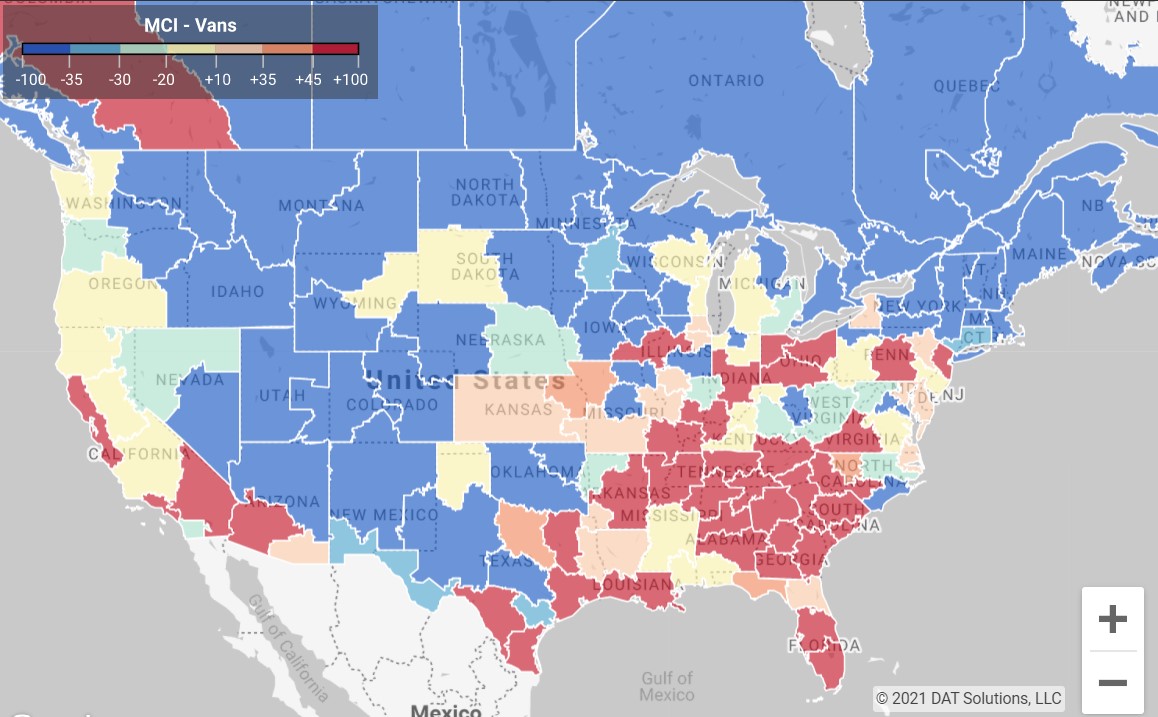
Market Conditions
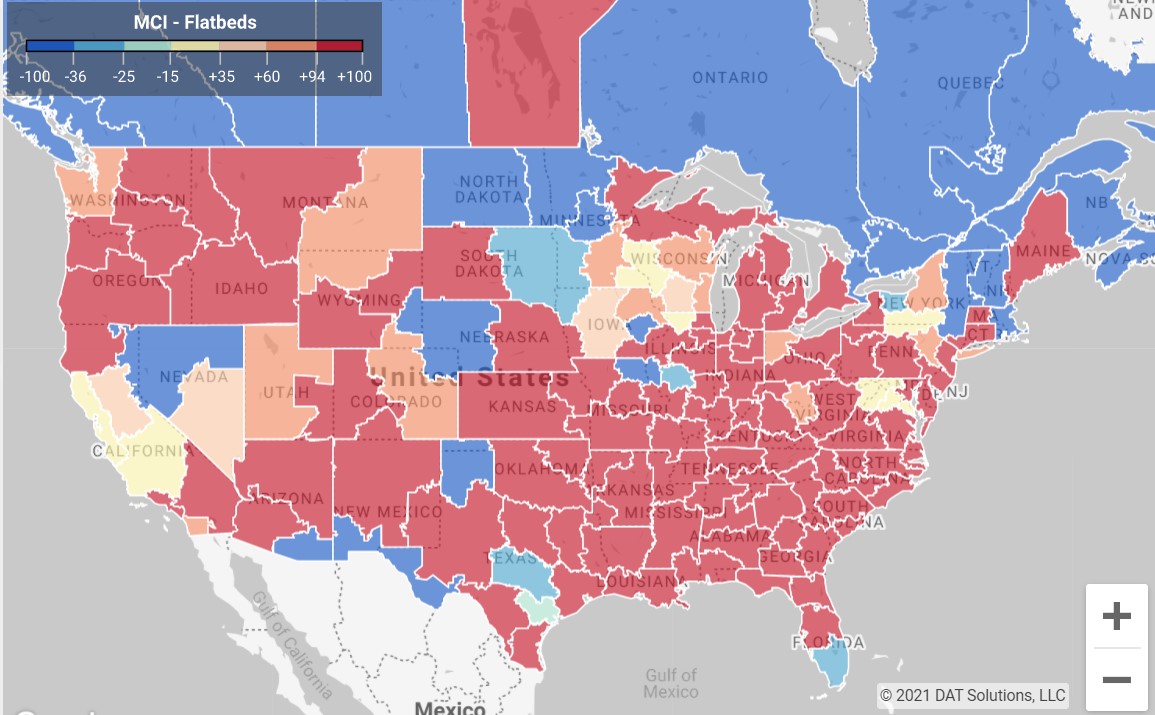
This morning's market conditions are shown below for the previous day for van, reefer, and flatbed. Areas in red are extremely tight.
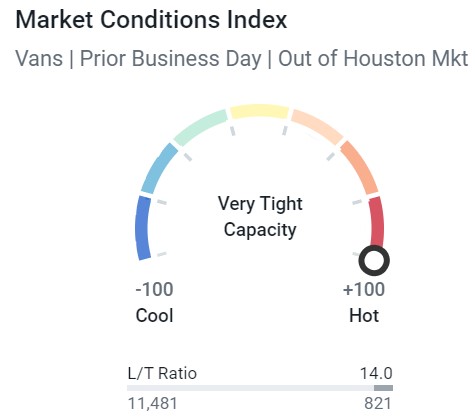
Van Capacity
Van capacity loosened some across the United States over the past couple of weeks, but the areas that are tight, are VERY tight. See, for example, the load-to-truck ratio in Houston this morning. There are 11,481 loads to only 821 trucks.
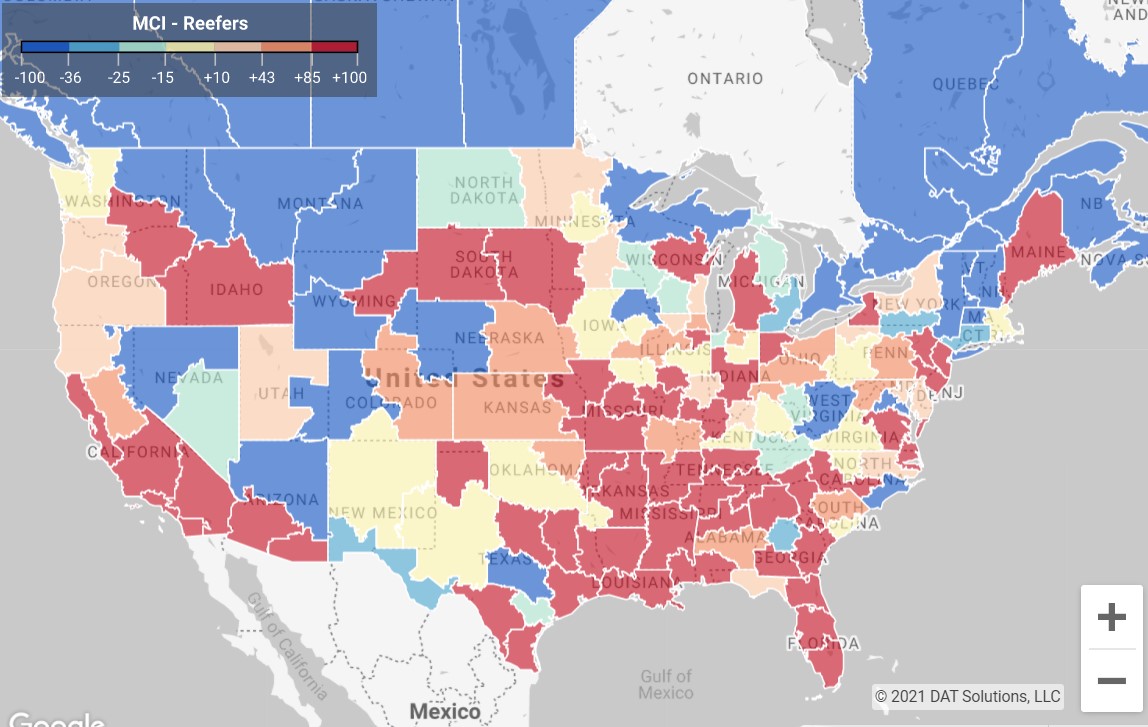
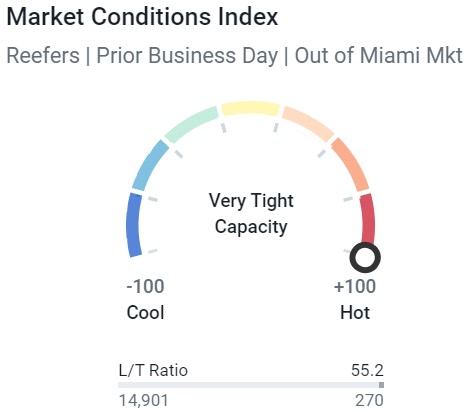
 Reefer Capacity
Reefer capacity dipped some last week but is seeing a tightening again at the beginning of this week. The Miami market is a standout for tight capacity, with almost 15,000 loads to only 270 trucks.
Flatbed Capacity
The flatbed market is on fire. Flatbed demand continues to grow stronger, which is affecting higher rates across the country. Flatbed markets are unseasonably tight - DAT
Who's Got the Power?
This week's DHL pricing power index lands at 70, still favoring carriers but softening slightly as capacity temporarily loosens up a little.
The pricing power index is a weekly gauge put out by DHL that indicates who has more sway in negotiations when it comes to pricing and freight rates. (Source: Freightwaves)

Other stories of interest:
- Amazon's in-garage grocery delivery expands nationwide
- Home builders are growing more confident about the housing market — despite the rising cost of construction materials
- First quarter intermodal volumes show ongoing gains, reports IANA
- Ford, VW face more work stoppages due to chip shortage
Shippers rely on the relationships they have with their 3PLs to ensure a smooth continuation of service whenever capacity gets tight. We hope you will continue to count on Choptank for all your freight needs, whether it be van, reefer, truckload, LTL, intermodal or cross-border shipping.
We would love to hear from you
What do you think about the Choptank Transport Market Brief? Do you find it helpful? Is there additional information you would like us to include or is there information you don't find relevant? Send comments to: marketing@choptanktransport.com
Have a Question? Ask one of our Experts
Your sales representative or a member of our professional logistics team is ready to help, so give us a call! 800.568.2240. If this information was forwarded to you and you would like to receive it, sign up here.