


Upcoming Roadchecks Will Further Constrict Capacity
April 20, 2021
The Choptank Weekly Market Brief is offered exclusively to Choptank Transport customers to provide accurate, timely and relevant freight market information. The contents of this brief are collected from reputable sources including DAT, Freightwaves/Sonar, Truckstop.com, the Department of Labor, the Department of Transportation, and other sources as cited throughout the brief.
The Commercial Vehicle Safety Alliance's International Roadcheck Week is only a fortnight away. The three-day event runs from May 4 - 6, bringing awareness to the importance of "vehicle maintenance and driver readiness." This year's focus will be on commercial vehicle lighting and hours of service, two areas that topped the violations list last year.
Choptank Transport Executive VP Steve Covey says that historically, the road checks have a significant impact on capacity. "There are owner-operators who opt not to run at all during this time to avoid being taken out of service. We like to remind our customers that capacity shortages and higher spot pricing are common consequences of Roadcheck Week. Shippers should plan ahead and get their freight out early if they can."
Last year there were more than 50,000 roadside inspections in North America, including Canada and Mexico, and of those, 20.9% were put out of service for violations. On a positive note, 13,088 CVSA decals were issued to vehicles and drivers that were inspected with no issues.
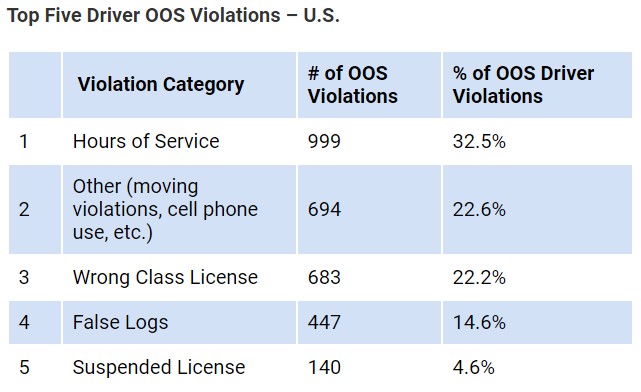
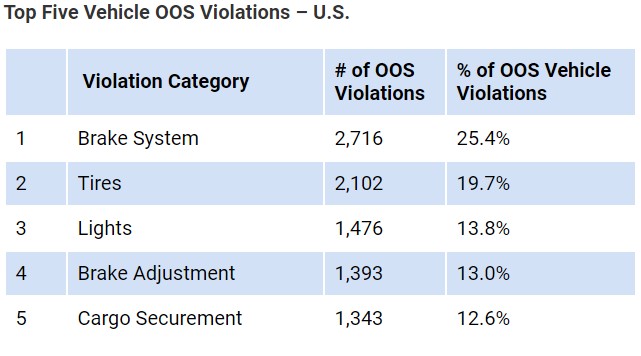
Statistics from Last Year
(Chart #1) 2020 U.S. Driver Violations
_______________
(Chart #2) 2020 U.S. Vehicle Violations
 __________
This week's video
The Warehouse of the Future, or Today?
3-D warehouse robots, meet "Squid."
Number of the Week
$2.3 BILLION
The amount General Motors is investing in a battery factory in Tennessee
to power new GM electric vehicles, creating 1,300 jobs
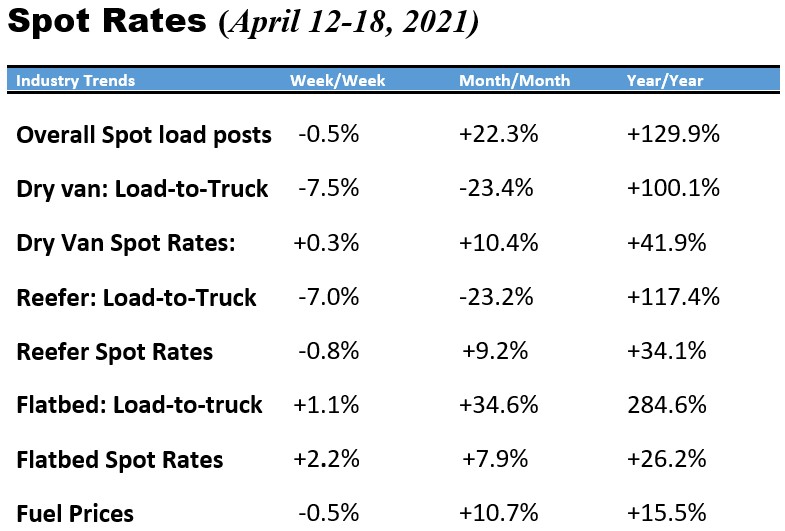
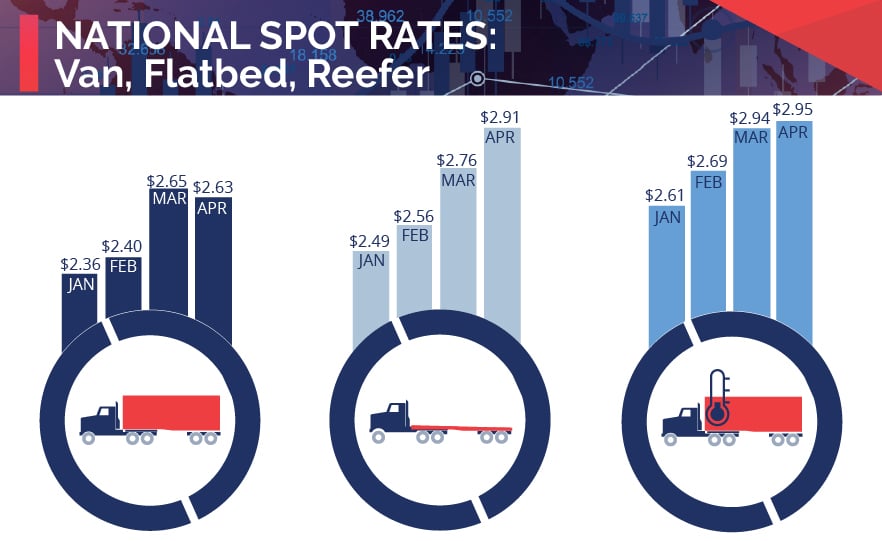
What's Up in the Spot Market?
Compared with the last capacity crunch in 2018, spot rates are 26 cents higher than during the same time that year, with the national average 81 cents higher than last year. Load-to-truck ratios are down for both van and reefer compared with last week, but it remains a very tight market.
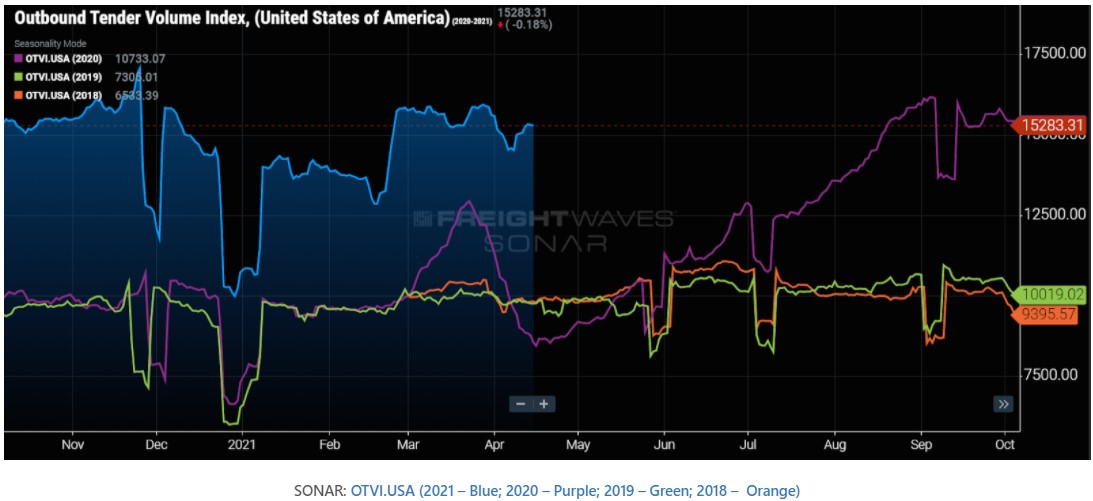
Outbound Tender Volumes
Reefer outbound tender volumes are slightly down (falling 4% last week) as produce is only beginning to ramp up and people are starting to spend less at the grocery and are eating out more.
National volumes for both reefer and van, however, are up 24% from pre-COVID numbers and are slightly back up from last week. The chart below compares the 2021 volumes in blue with the last three years in purple, orange, and green.
Carriers are chasing the rates and volumes in high-demand areas and avoiding undesirable lanes, creating an imbalanced market where smaller hubs are feeling the consequences.
Areas with the most significant changes in volumes: Volumes have increased most (although only slightly) in Charlotte, Stockton, Ontario, and Memphis. Areas with the greatest decrease in volumes are Chattanooga, Houston, Columbus, and Harrisburg, but again... these are only marginal increases.
Chart Below: National outbound tender volume with this year's data in blue compared with the previous three years in purple, green, and orange. (Source: Freightwaves/Sonar)
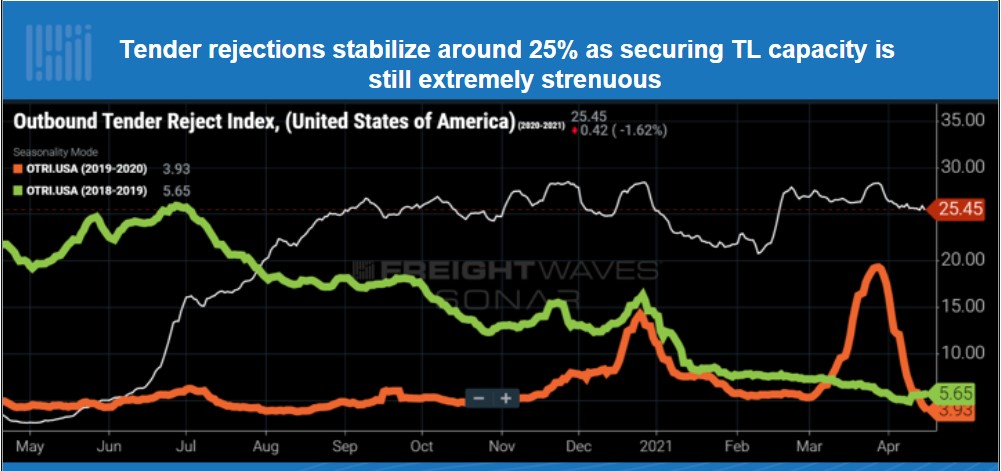
 Outbound Tender Rejections
Finding available trucks, whether it be for reefer or van, is difficult these days. Last week's outbound tender rejection index saw little overall change and is holding steady around the 25% mark.
Reefer freight is still extremely difficult to cover with 50% of all shipments being rejected. Areas like Savannah and Little Rock are seeing over 80% rejection rates. Many markets east of Colorado saw dips in rejections late last week while markets in the Midwest and Southeast saw elevated rejection rates.
Areas with the most significant changes in rejections: Rejection rates have relaxed marginally in Atlanta, Chattanooga, Memphis, and Harrisburg but have risen in Joliet, Chattanooga, and Ontario.
Chart Below: National outbound tender rejections with this year's data in gray compared with the previous three years in orange and green.
Economy
Stores are opening back up and people are spending more on retail and services. Total card spending, according to Bank of America credit/debit card data, increased 59% on a one-year change and 14% on a two-year for the seven days ending April 10th. Retail sales (minus autos) saw an increase of 8.4% month-over-month. Consumers seem to feel confident in their purchasing habits.
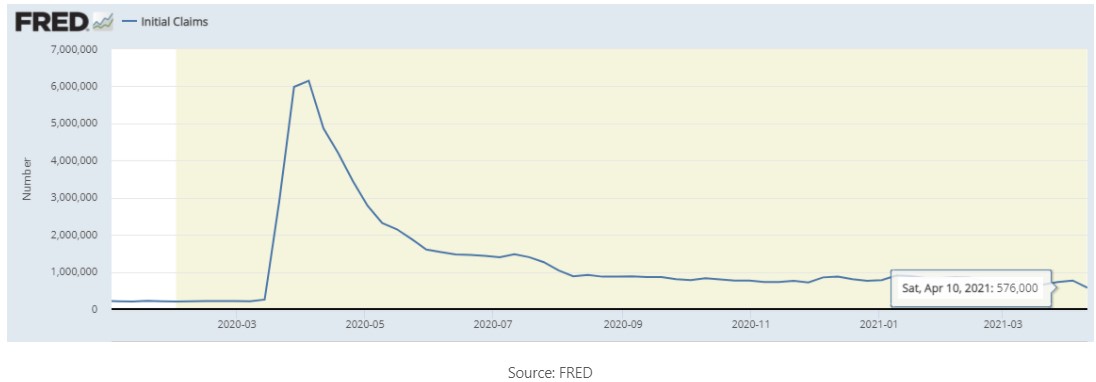
Jobless Claims
The month of March added a whopping 916,000 new jobs to the U.S. economy, while initial jobless claims fell to 576,000, reaching a new post-COVID low. The unemployment rate declined to 6% and is an encouraging sign that coincides with more vaccinations and a strengthening economy.
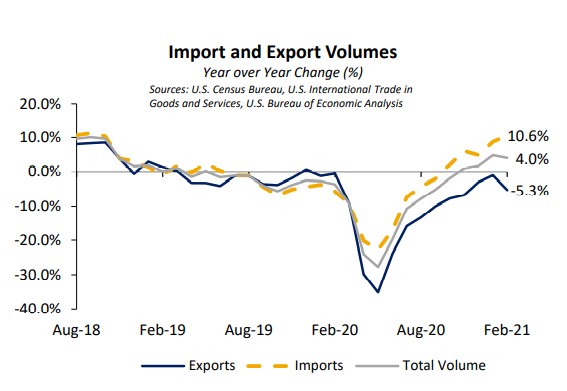
Ports
The ports are slowly catching up with the backlog that was so prevalent in Q1. Much of the freight has been rerouted to East Coast and Gulf Coast ports, as well as Vancouver and Seattle, serving as a relief valve for the crowded Los Angeles and Long Beach markets. Import volumes overall are up over 10%.
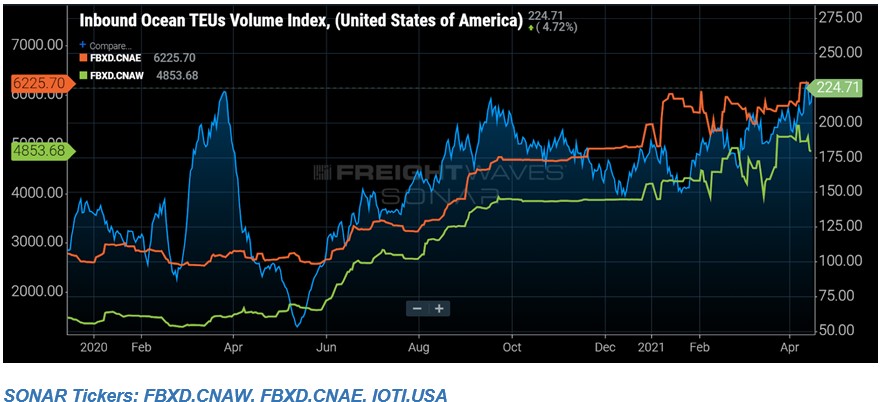
Ocean Freight Volumes, East Coast vs West Coast
The chart below shows the Freightos Baltic Daily Index of 40- foot containers from China to America's East Coast (orange line) and China to America's West Coast (green line). Reviewing inbound volumes of overseas freight movement can give us a glimpse into what's in store for intermodal and truckload volumes. (Source: Freightwaves Sonar)
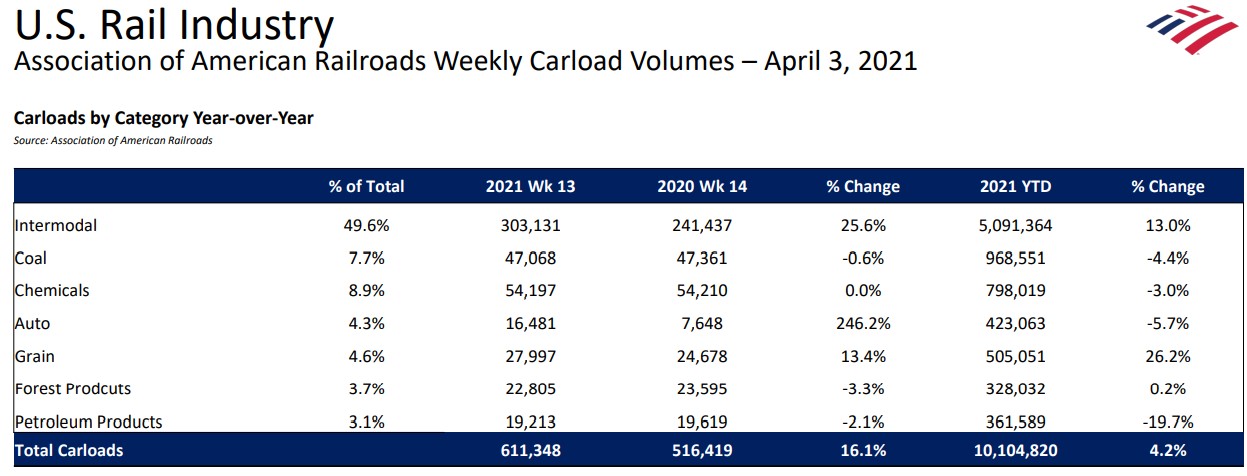
Rail/Intermodal
Intermodal volumes are showing a 25.6% increase over last year during the first week of April, as shown in the carload-by-category data below from Bank of America's Surface Transportation Industry Update for April 2021.
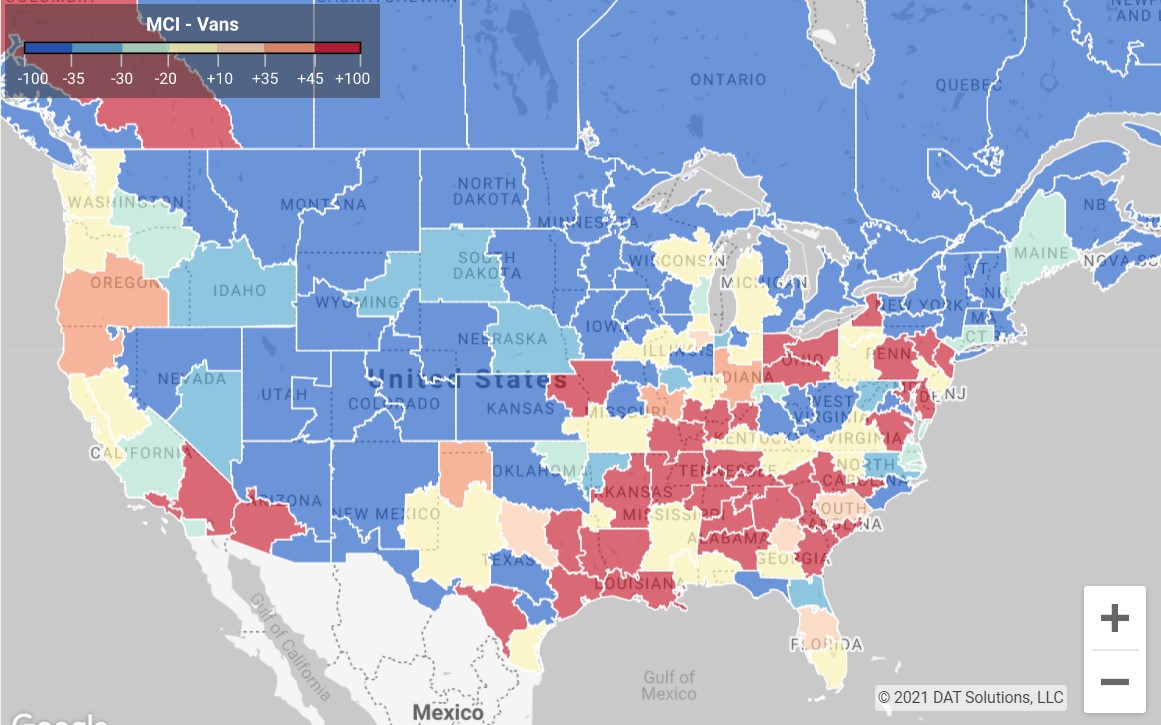
Market Conditions
This morning's market conditions are shown below for the previous day for van, reefer, and flatbed. Areas in red are extremely tight.
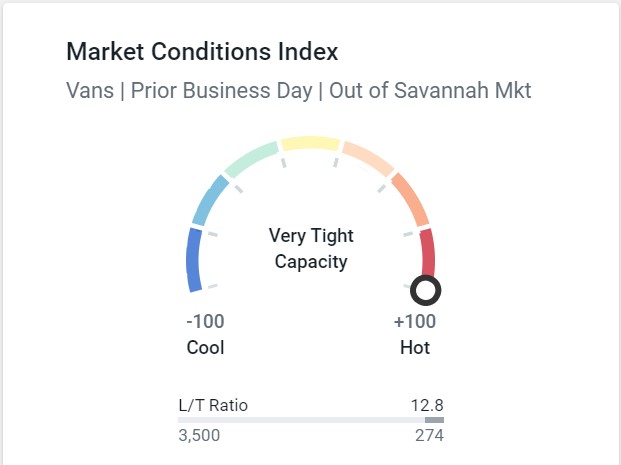
Van Capacity
Van capacity has loosened some across the United States as shown in the map below. There are still many markets that are experiencing a shortage of equipment, however, such as the Savannah market, where yesterday the load-to-truck ratio was 3,500 to 274.
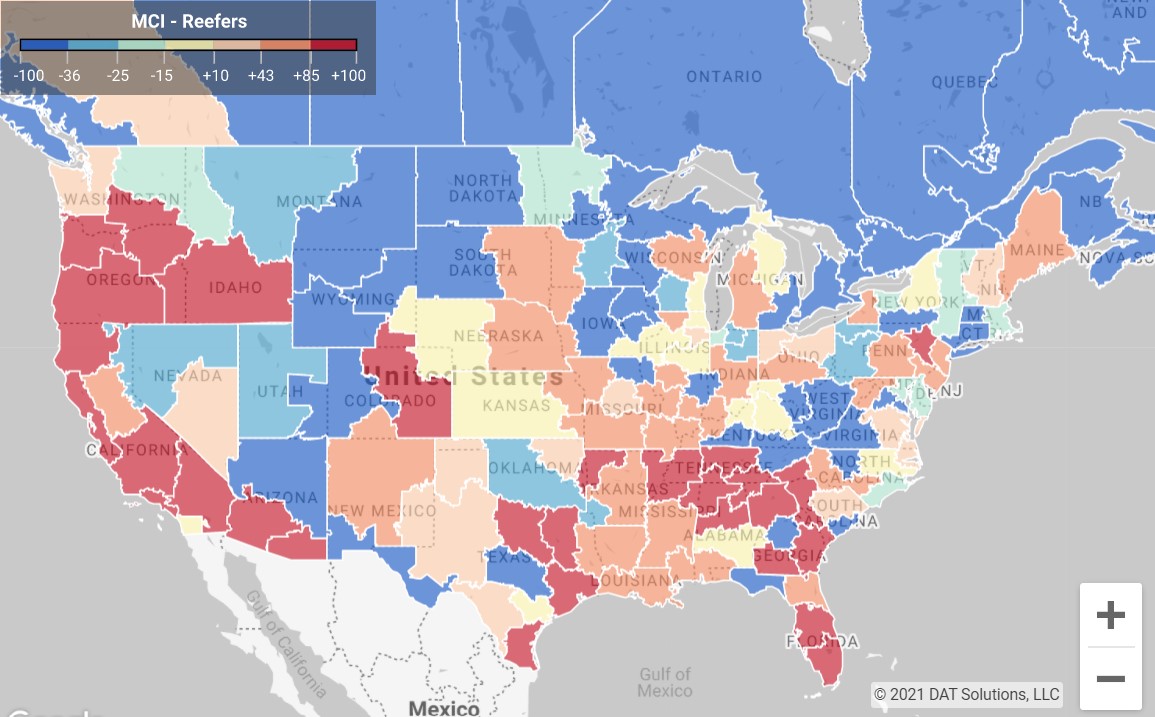
 Reefer Capacity
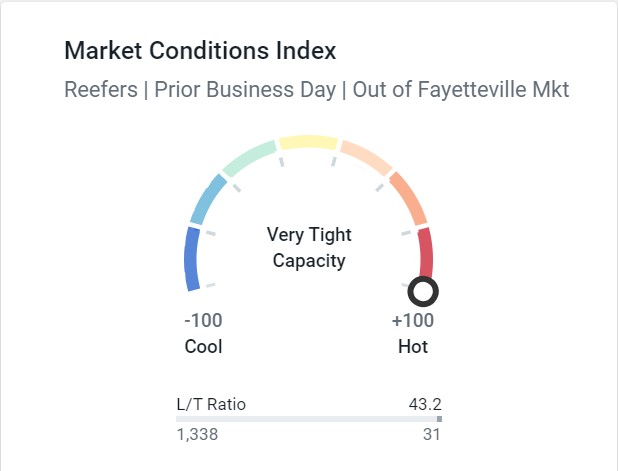
Reefer capacity also remains tight around certain markets but also has loosened slightly over the last week. Fayetteville, Arkansas, for example, is extremely tight right now with a load-to-truck ratio of 1,338 to 31.
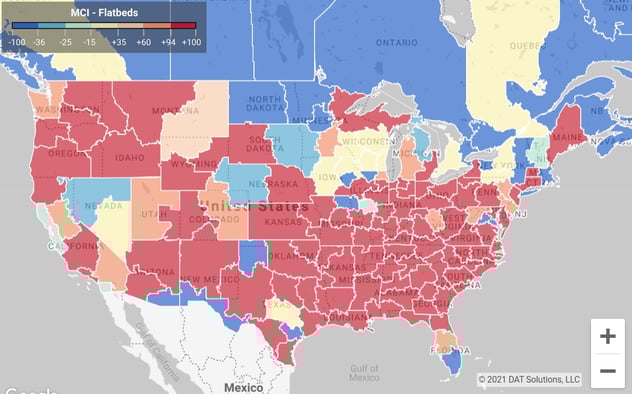
 Flatbed Capacity
Flatbed demand remains strong and capacity is extremely tight across the United States. Montgomery, Alabama, for example, is showing a load-to-truck ratio of 14,136 to 23.
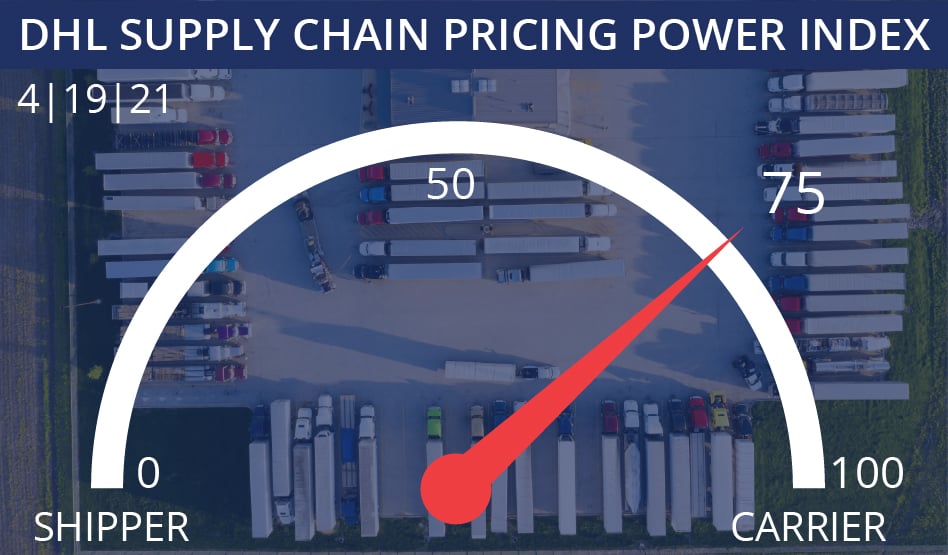
Who's Got the Power?
The DHL Pricing Power Index gauge is holding steady at 75 as the market remains tight with high volumes and elevated rates.
The pricing power index is a weekly gauge put out by DHL that indicates who has more sway in negotiations when it comes to pricing and freight rates. (Source: Freightwaves)
Shippers rely on the relationships they have with their 3PLs to ensure a smooth continuation of service whenever capacity gets tight. We hope you will continue to count on Choptank for all your freight needs, whether it be van, reefer, truckload, LTL, intermodal or cross-border shipping.
We would love to hear from you
What do you think about the Choptank Transport Market Brief? Do you find it helpful? Is there additional information you would like us to include or is there information you don't find relevant? Send comments to: marketing@choptanktransport.com
Have a Question? Ask one of our Experts
Your sales representative or a member of our professional logistics team is ready to help, so give us a call! 800.568.2240. If this information was forwarded to you and you would like to receive it, sign up here.