Mean Winter Storms
Leave Lingering Effects
February 23, 2021
The Choptank Weekly Market Brief is offered exclusively to Choptank Transport customers to provide accurate, timely and relevant freight market information. The contents of this brief are collected from reputable sources including DAT, Freightwaves/Sonar, Truckstop.com, the Department of Labor, the Department of Transportation, and other sources as cited throughout the brief.
The aftereffects of the bad weather that befell more than 70% of the United States last week are evident in the the "Trucks in Market" chart below. The red blocks (tight capacity) show just how widespread the disruption was to most markets. The green blocks indicate loose capacity, and there aren't many of them. (Source: Freightwaves)
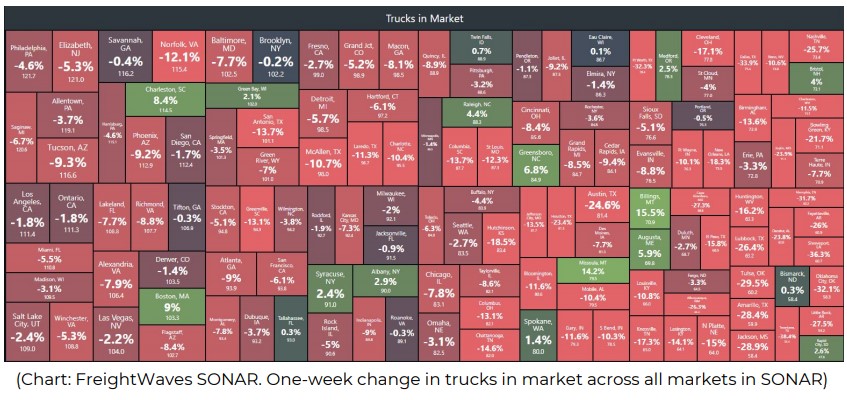
This week's markets continue to struggle with tight capacity and high spot rates. Shippers are now scrambling to acquire trucks as the weather improves in the Southwest, Southeast and Midwest, where many roads last week were impassable and freight remained immobile for several days. Look for a surge in tender rejections as trucks fill up fast and capacity becomes harder to come by until all is caught up.
Choptank Transport helped deliver vital relief to Texas residents over the weekend through the Bregman Family Astros Foundation.
Read about it here.
Watch news coverage of the event above.
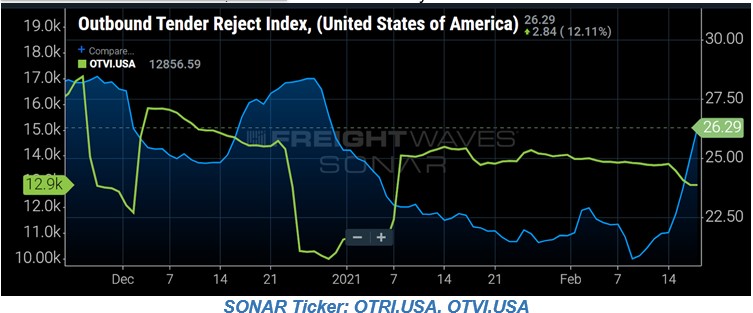
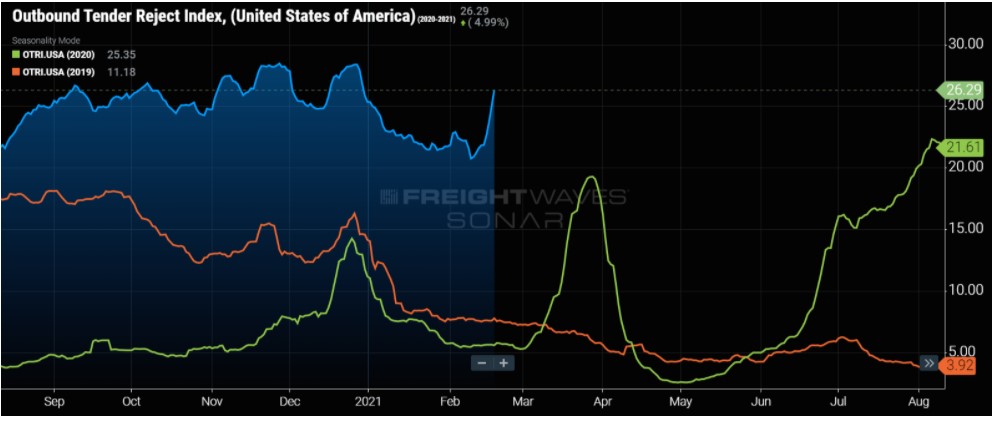
The national outbound tender rejection index this weekend was 26.29, meaning that more than 25% of all freight is being rejected.
It is interesting when tender volumes and tender rejections go in opposite directions, because it means that supply and demand both are regressing, and in this recent case, supply declined faster than demand. This is, however, atypical of the market and only a temporary anomaly due to the recent weather events.
Charts below: Top chart shows nationwide outbound tender rejections in blue versus nationwide outbound tender volumes in green (three months). Bottom chart shows the same information but over a longer period of time (one year) and in relation to the two previous years. (Graphs: Freightwaves/Sonar)
Number of the Week
3,140
The number of trucking companies that went out of business in 2020 due to the pandemic, compared with 1,000 the year prior.
- Transport Topics, Feb. 22 edition
The Economy
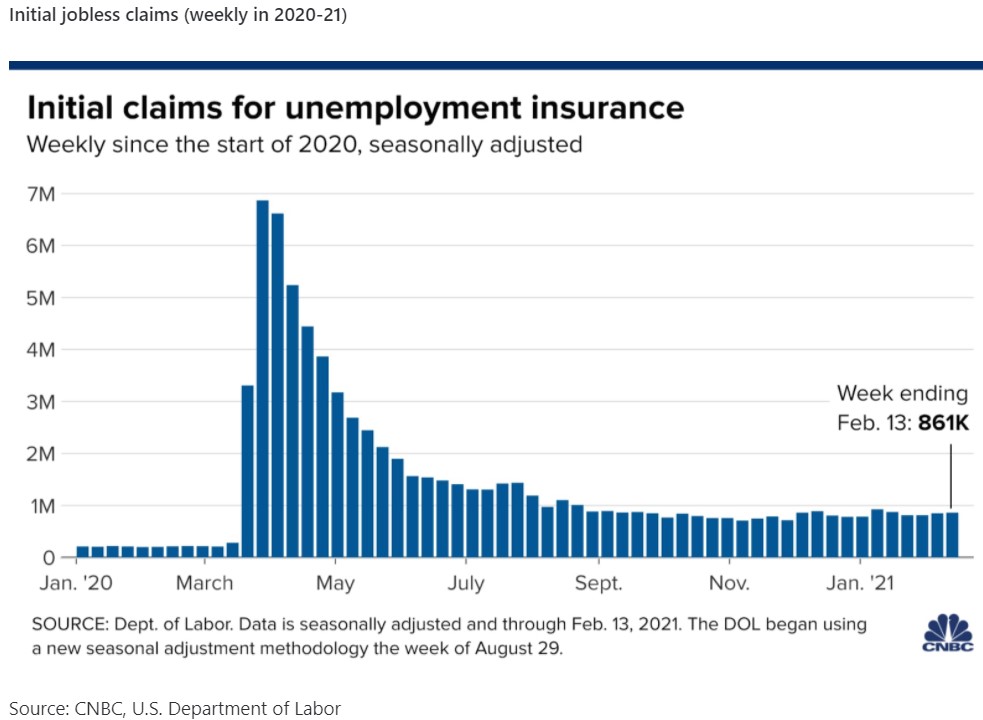
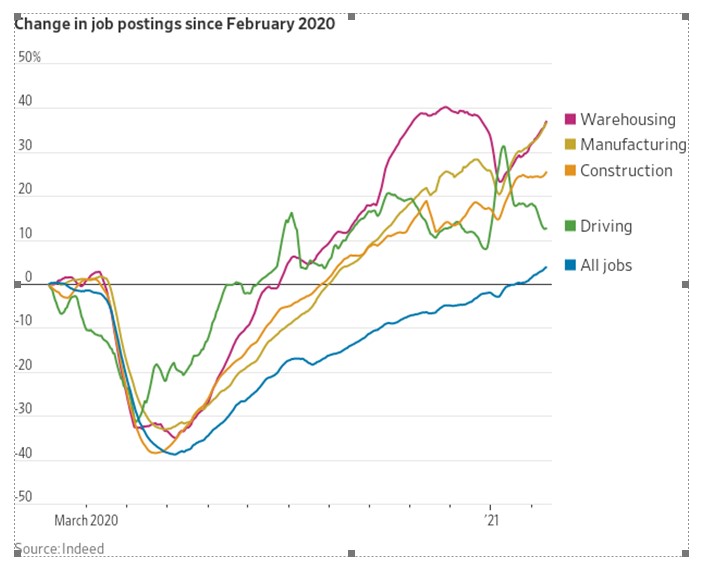
Recent data shows that blue collar jobs are responsible for the lion's share of the increased activity in the job market. Warehousing, housing construction and package delivery services have met and exceeded pre-pandemic levels. A story in the WSJ also suggests that employment in the services arena will rebound quickly once the pandemic subsides.
Consumer Spending: The Latest Numbers are In
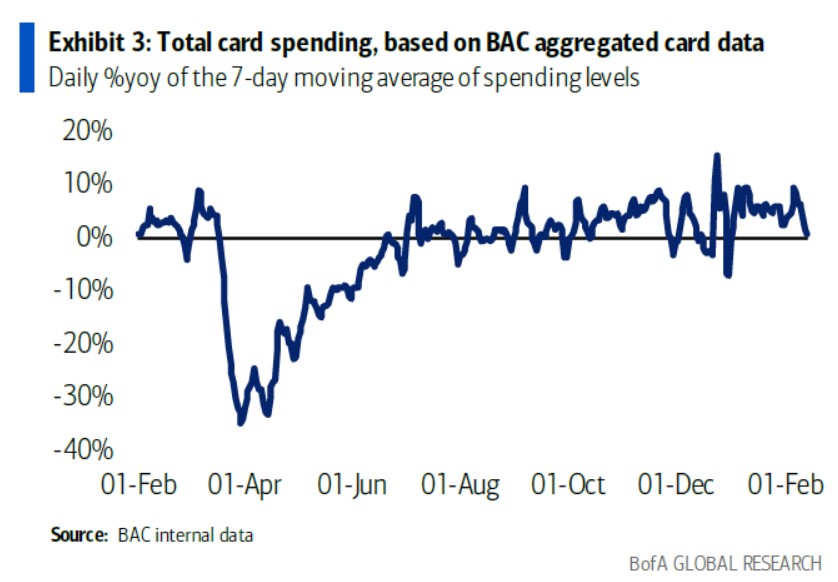
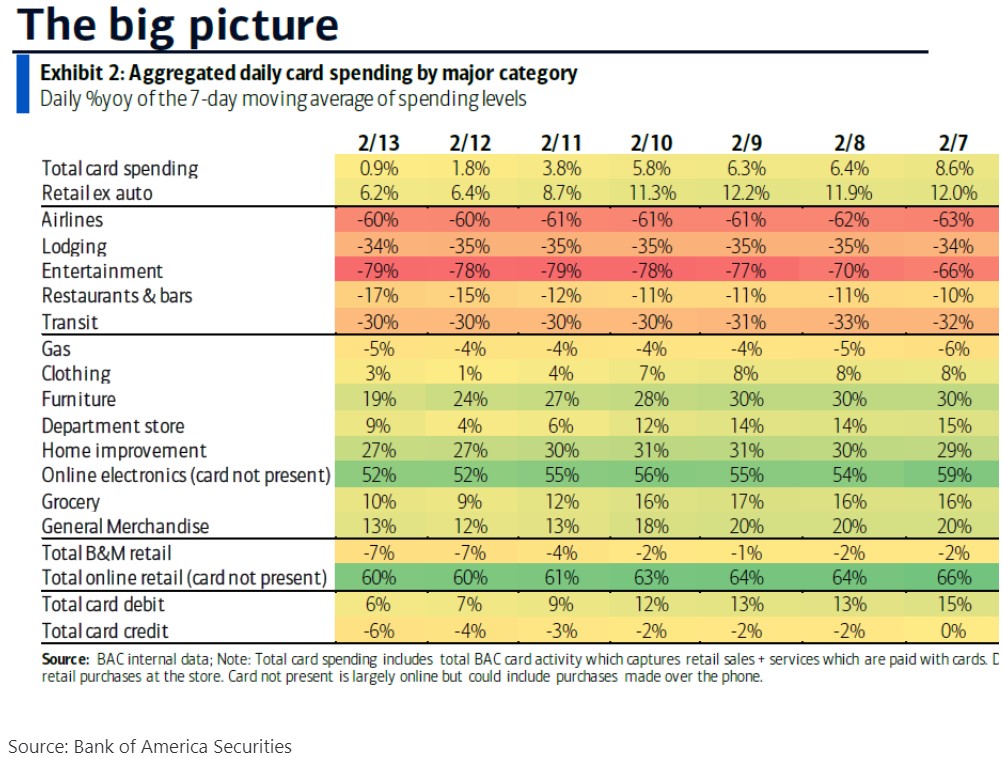
There was a significant drop in consumer spending last week, which came as no surprise due to the constraints of the weather and all the problems that came with snow, ice and unsafe road conditions. According to Freightwaves, "Overall card spending decelerated significantly this week from 9.7% year-over-year last week." There is, however, a bright side. If you review only retail spending (minus auto), the numbers are up by 6.2% year-over-year for the same week.
Less-Than-Truckload Market
LTL freight activity equally suffered from the winter storms last week with shut-down facilities and delays. Choptank Transport Director of Specialized Logistics Doug VanDerveer commented on this past week's situation.
"The few reefer LTL drivers who where brave enough head out into the ice storm off our dock on February 13 are still delivering, and quite a few will not finish until today or tomorrow. One of our largest cold LTL customers, based in Austin, Texas, had their entire network down due to nationwide truck delays. Who would think an ice storm in Texas would cause trucks to be delayed a day or two in sunny Florida, but they were," says VanDerveer. "Receivers in the ice-stricken areas are still experiencing staff shortages due to ongoing power outages. We anticipate the receivers will get back to normal sometime this week. However, it may take another week or two to get the carriers back into their normal routines before the reefer LTL market settles down."
Ports
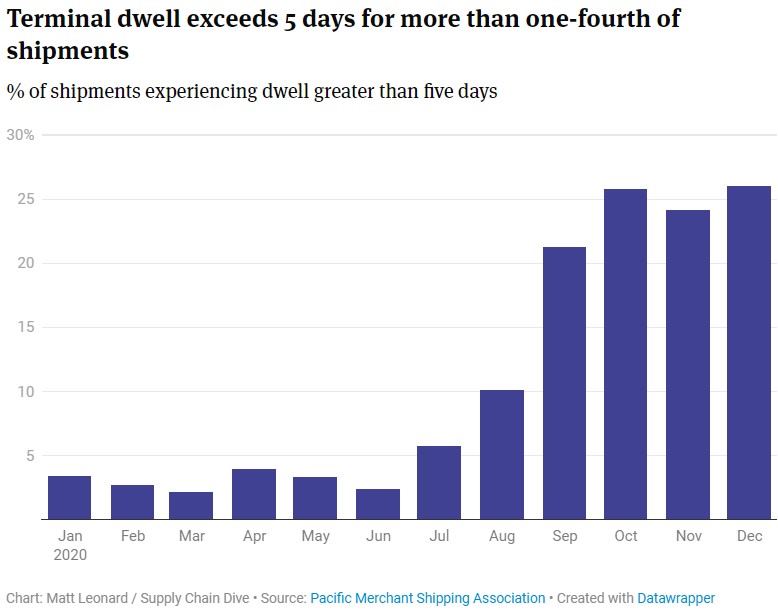
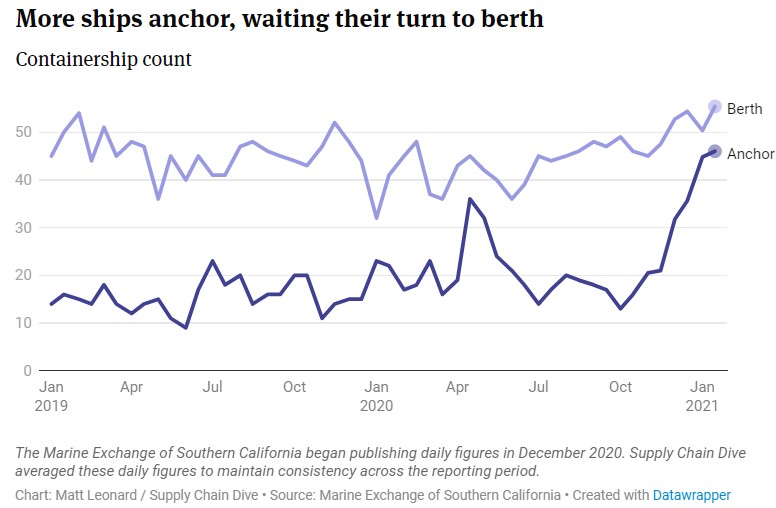
A recent article in SupplyChainBrain examined several different possible solutions to alleviate the continuing logjam that is plaguing the West Coast ports, "Shippers Need Alternatives to West Coast Port Congestion." Although some of the measures discussed in the article could bring temporary relief, none are instant fixes.
As the problem only seems to be getting worse, some industry experts say that without immediate and long-term investments in infrastructure and equipment, the United States will continue to see delays and an imbalance of freight movement through the end of this year.
Charts: Source Supply Chain Dive/Marine Exchange Southern CA
Market Conditions
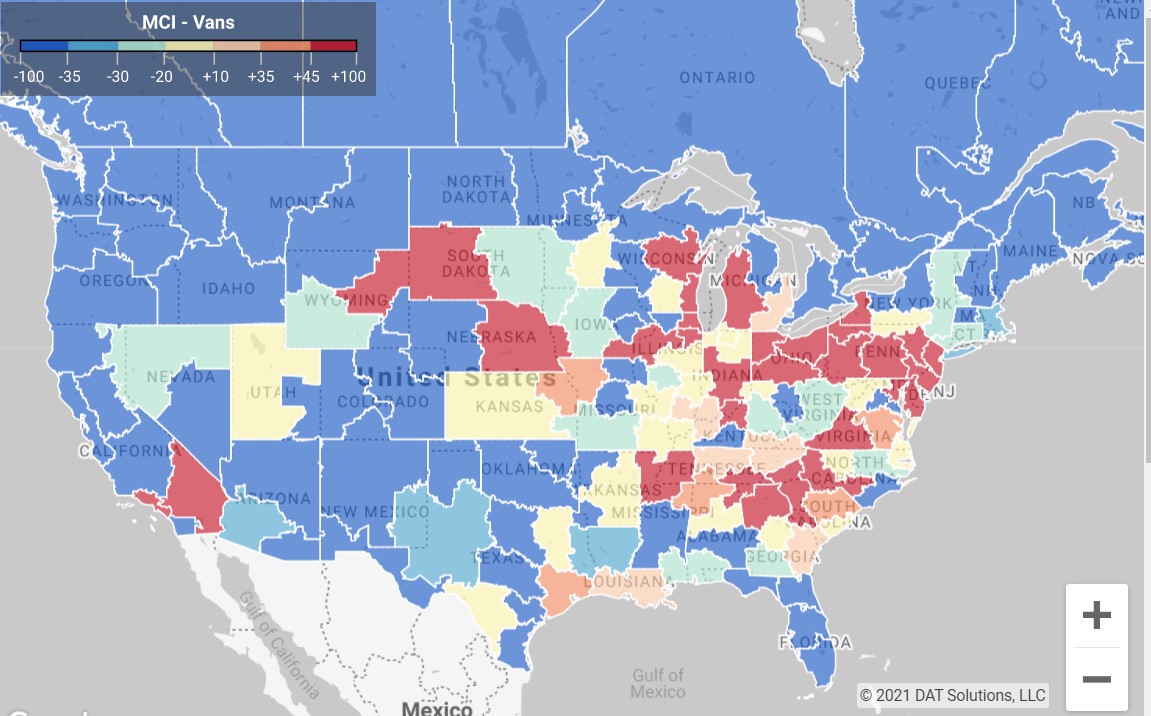
This morning we are seeing some loosening of capacity as snow and ice melt and road conditions are returning to normal. There are still quite a few markets playing catch up with backlogged freight from last week's storms and lingering treacherous conditions over the weekend. Areas in red show tight capacity. (Map Source: DAT)
Van Capacity
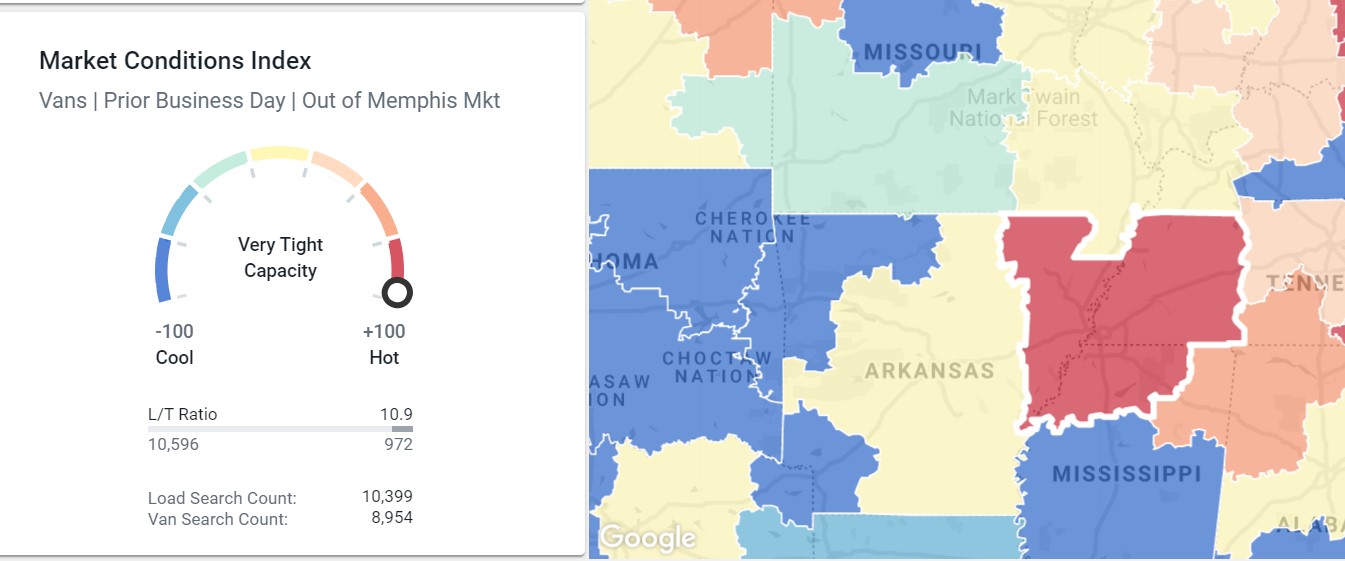
Memphis Market Today
One example of an area that has very tight capacity today (chart below) is Memphis. There are 10,596 loads compared with 972 trucks. All areas on the capacity maps in red will be short on capacity.
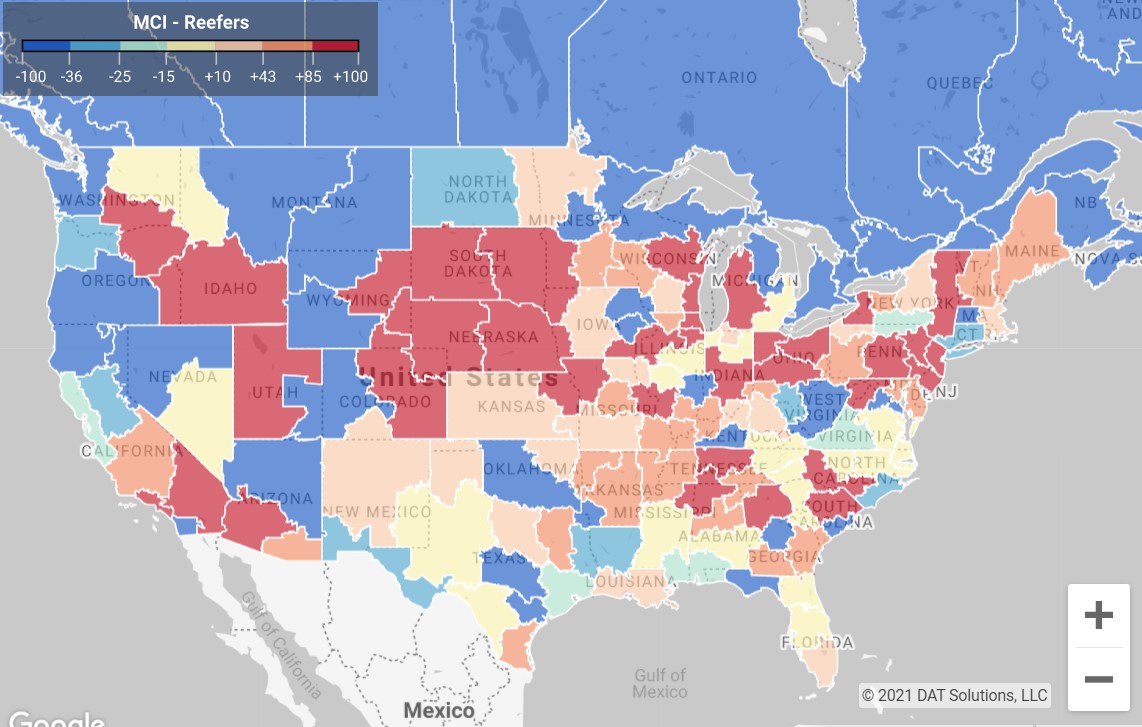
Reefer Capacity
Flatbed Capacity
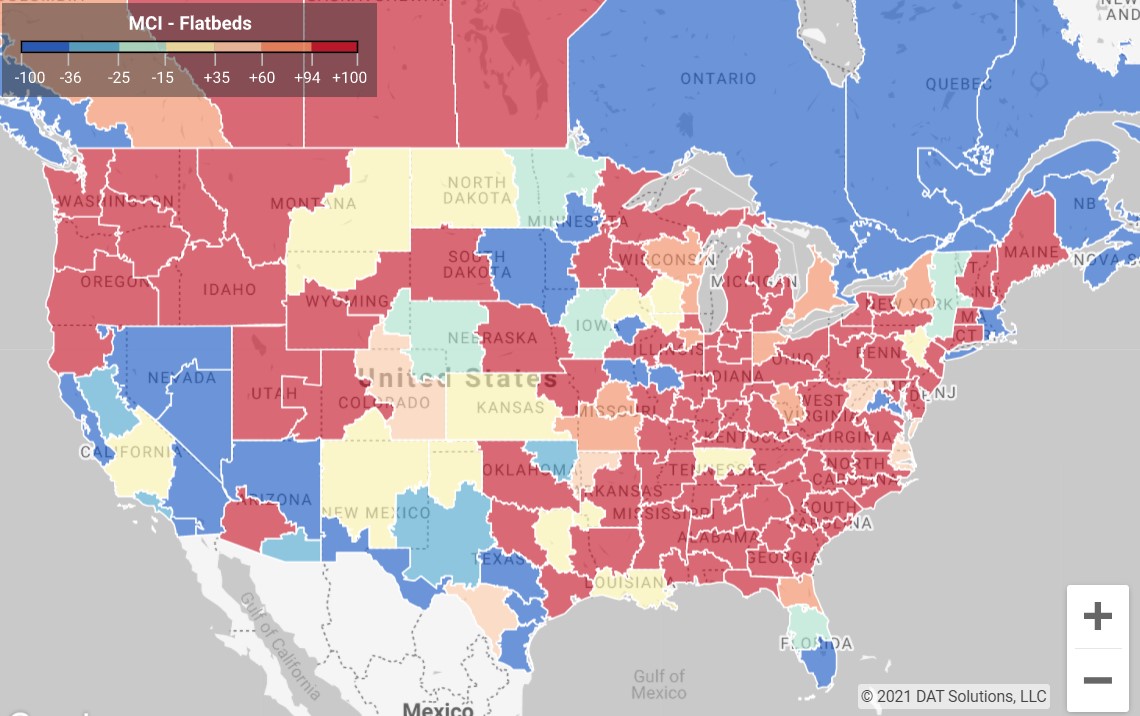
Flatbed capacity is still extremely tight in the eastern half and northwestern parts of the country as construction ramps up. Rates will be highest and capacity tightest in the red areas of the map.
Who's Got the Power?
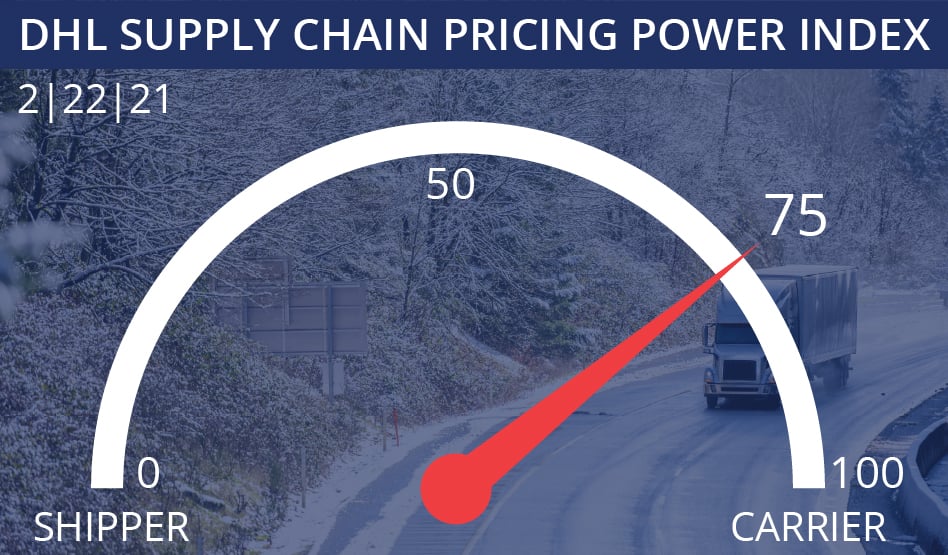
The DHL Pricing Power Index gauge jumped to 75 as capacity became even more strained during the recent bad weather.
The pricing power index is a weekly gauge put out by DHL that indicates who has more sway in negotiations when it comes to pricing and freight rates. The farther the needle leans to the left of the gauge, the more power the shipper has in negotiation. The farther to the right, the carrier has the upper hand. (Source: Freightwaves)
Spot Rates Soar From Winter Storms
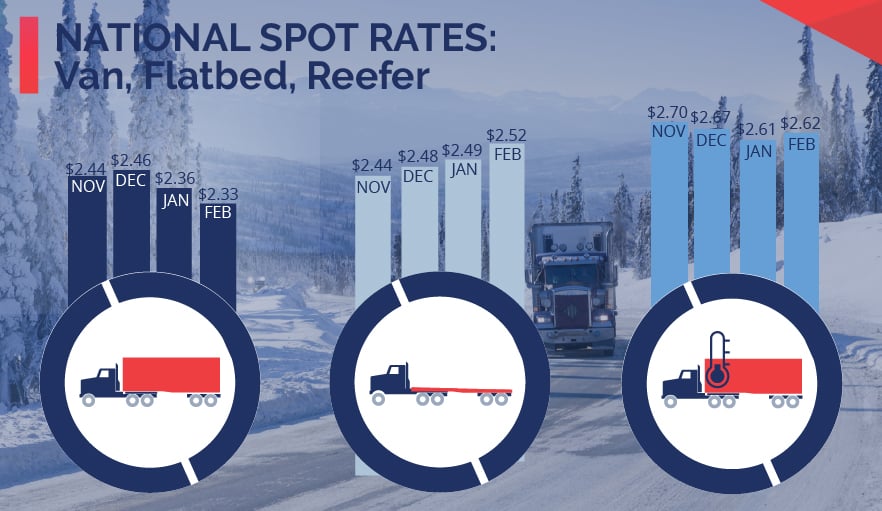
(Below stats from February 15 - 21, 2021) Load-to-truck ratios surged as the weather became a factor and loads became difficult to cover. Contract freight was pushed to the spot market, and high rates followed as transport was difficult if not impossible in many areas.
Overall Spot load posts rose 18.9% w/w, - 0.4% m/m and up 67.9% y/y.
Dry van: Load-to-Truck ratio rose 64.8% w/w, -11.7% m/m and up 92.0% y/y.
Dry Van Spot Rates: Rates are up 8.5% w/w, -4.1% m/m, and up 25.7% y/y.
Reefer: Load-to-Truck ratio is up 65.0% w/w, down -4.3% m/m, and up 54.4% y/y.
Reefer Spot Rates: Rates up 8.9% w/w, down -2.5% m/m, and up 16.2% y/y.
Fuel prices have risen by 2.7% w/w.
(Source: DAT Trendlines)
We would love to hear from you.
What do you think about the Choptank Transport Market Brief? Do you find it helpful? Is there additional information you would like us to include or is there information you don't find relevant? Send comments to: marketing@choptanktransport.com


